Opponent scouting for D1 soccer

Less time building the scout. More time building your game plan.

Review your next opponent's strengths, weaknesses, and tendencies, with stats and visuals organized for your staff. Spend less time assembling the scout and more time preparing for the match.

“Who are they going to start?”

→ Answered in Overview

“Where do they concede chances?”

→ Answered in the Report

“Who should our right back worry about?”

→ Answered in Players and Matchups

“Who takes their set pieces?”

→ Ask Scout Chat

In development. Available next season.

Built and used inside a D1 program UC San Diego men's and women's soccer Men's and women's D1

Opponent preparation

Get to the coaching decisions sooner.

Review the findings, check the evidence, and decide what to work on with your players.

  1. Open your opponent's report

    Start with your next opponent's strengths, weaknesses, and tendencies in one place.

  2. Review the finding and its evidence

    Read the finding with its supporting stats and charts.

  3. Plan your preparation

    Choose what to review on film and rehearse in training.

Report example

Prepare to defend the cutback.

Team A creates cutbacks leading to shots at 0.733 per 90 versus 0.288 across D1. Team B concedes them at 0.647 versus 0.283.

From a 2025 men's scouting report. Team and player names are anonymized.
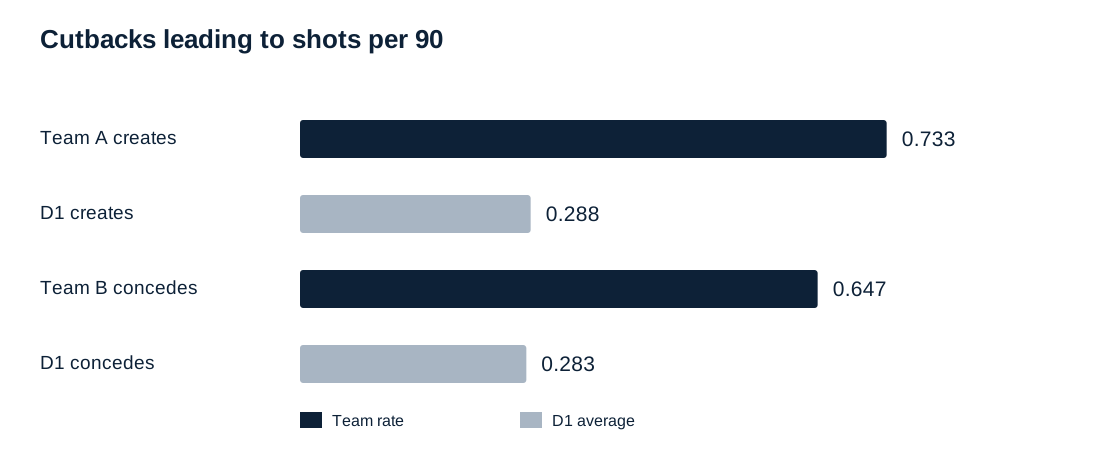
Cutbacks leading to shots per 90: Team A creates 0.733 versus D1 0.288; Team B concedes 0.647 versus D1 0.283.
Cutbacks leading to shots per 90, compared with D1 averages.
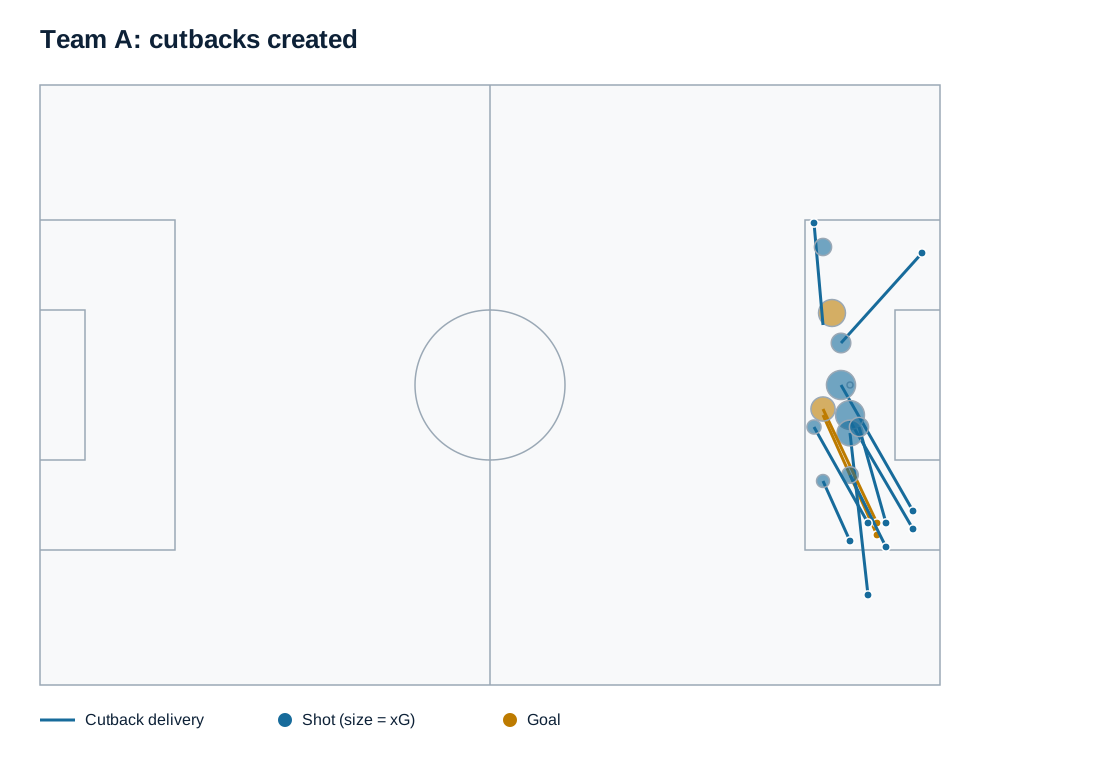
Supplied pitch map of Team A's cutback delivery paths and resulting shots. Shot size represents xG; goals are marked separately.
Team A: 11 cutbacks created across 7 referenced matches.
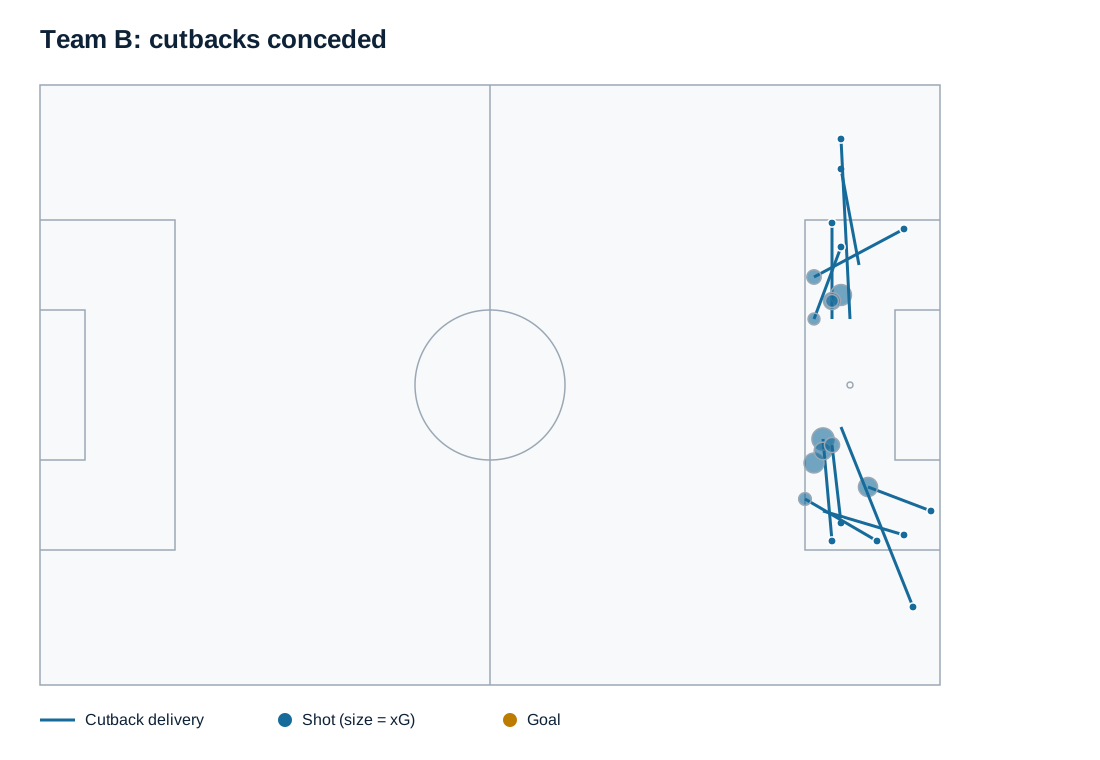
Supplied pitch map of Team B's conceded cutback delivery paths and resulting shots. Shot size represents xG; goals are marked separately.
Team B: 11 cutbacks conceded across 11 referenced matches.

Maps show 11 events per team. The event list does not include the total minutes used to calculate the per-90 rates.

Review 10 timestamped film references (5 per team)

Goals are listed first, followed by shots ranked by xG. Use the video times to find each event in your footage. Video playback is not available here.

Team A: cutbacks created

2 cutback goals and the 3 highest-xG shot examples.

Team A: cutbacks created film lookup
MatchDeliveryMatch clockOutcomeVideo time
Match 03Player 031H 47:50Goal47:51
Match 04Player 032H 78:15Goal90:05
Match 01Player 012H 90:09Shot101:46
Match 02Player 021H 6:00Shot6:02
Match 03Player 041H 7:34Shot7:35

Team B: cutbacks conceded

No goals conceded in this sample. The five highest-xG shots are listed below.

Team B: cutbacks conceded film lookup
MatchDeliveryMatch clockOutcomeVideo time
Match 08Player 071H 4:29Shot4:31
Match 09Player 081H 25:03Shot25:11
Match 10Player 092H 73:39Shot81:07
Match 11Player 101H 3:30Shot3:38
Match 12Player 111H 48:24Shot48:32

Film references available. In-report video playback is in development.

Comparing stats
See the relevant numbers alongside D1 benchmarks.
Building visuals
Review maps and charts already attached to the finding.
Finding film instances
Use match and event references to locate the sequences behind the finding.

Inside the app

Every opponent, four pages

  1. 1
    The label

    Each finding is marked as a strength, weakness, or tendency.

  2. 2
    The finding

    A short explanation of what the stats show.

  3. 3
    Supporting stats

    Supporting stats alongside D1 averages.

  4. 4
    Supporting visual

    Pitch maps and charts showing the events behind the finding.

  5. 5
    Supporting film

    Film references available. In-report video playback is in development. Use the match and event references to locate supporting sequences in your video workflow.

Every section of the report

Each section answers a different coaching question, with findings built the same way.

Offensive

How they hurt you

  • Chance originsHow their attacks start: winning the ball, set pieces or build-up.
  • DribblingWhere they take players on, and whether it works.
  • Shooting and shot assistsWhere they shoot from and how the final ball arrives.
  • Progression and box entriesHow they move the ball forward and into your box.
  • Build-up tempoFast or patient, and which one pays off for them.

Defensive

Where you can hurt them

  • How they concedeThe routes that lead to chances and goals against them.
  • Defensive duelsWhere on the pitch they win and lose their duels.
  • PressingHow high and how hard they press, and what sets it off.
  • DisciplineCards and fouls, and who is at risk.

Team profile

How they run a game

  • Substitution patternsWhen they make changes, and how many at once.
  • Results by outcomeWhat looks different in the games they win and lose.
  • PenaltiesWho takes them, and how they have gone.

Matchups

Built for your team

Your team against theirs, both ways

  • Your attack vs their defenceWhere the way you create meets the way they concede.
  • Their attack vs your defenceThe mirror: where they can hurt you.
  • Player matchupsThe individual battles to win, from who actually faces whom.
  • Once subs come onHow the matchups change after their usual changes.

See every page for your next opponent.

Book a demo

Book a 30-minute demo

We'll walk through your next opponent's report and answer your staff's questions.

Open Calendly in a new tab

You can also book by email.

Email us to book a demo